The data I chose to use is somewhat relevant to digital media as it's the amount of Academy film awards awarded to animation studios, my data featured Pixar, Dreamworks as well as some other animation studios . The reason I did this was so that I could learn how to display my own data in a dynamic way in Processing, the sketches uses a rollover function which when triggered displays the studio's logo.

Here is a screenshot of the code which I have commented. In this sketch I use strings and integers to link numerical values to variables.
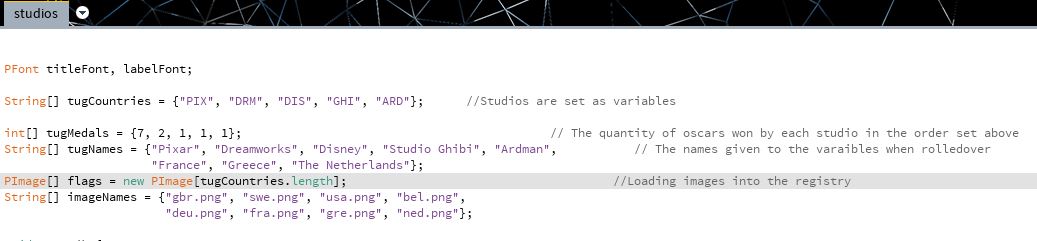
I also use variables to set the height and width of the bars in the chart as well as the spacing between each bar. I also use different fonts for the title and labels by calling them at different parts of the sketch.

No comments:
Post a Comment